


Weekly Crypto Outlook – March 2, 2026
Crypto markets remain highly sensitive to geopolitical developments, with US–Iran tensions dominating risk pricing this week. Bitcoin briefly dropped to $63,000 before recovering toward $70,000 as ETF inflows turned positive. While positioning has reset, sustained strength above $70,000 is needed to confirm a durable rebound.


TL;DR
Crypto markets remain fragile and highly sensitive to geopolitical developments, particularly the unfolding US–Iran tensions, which have dominated risk pricing this week. Technical factors like liquidity pools and fundamental drivers such as macro data and fund flows have taken a back seat as the market reacts to headline risk.
Bitcoin briefly sold off to $63,000 at the height of US–Iran stress before recovering toward the $70,000 zone. While structural liquidity remains subdued and whale distribution continues to weigh on price action, positioning has largely reset, funding has compressed significantly, and ETF flows have turned meaningfully positive for Bitcoin.
That said, conviction remains limited. Bitcoin likely needs to reclaim and hold above $70,000 to confirm a more durable rebound. Until then, consolidation with elevated volatility remains the base case, especially as geopolitical outcomes outweigh traditional macro and technical drivers this week.
In This Week’s Note
Macro View
Market Movers and Events, Last Week
Key Macro Drivers, The Week Ahead
Market Outlook
Macro View
Falling yields meet fragile confidence
The macro backdrop remains mixed and is being overshadowed by geopolitical risk.
The 10-year Treasury yield has moved decisively below 4.0%, potentially signaling the early stages of a broader regime shift. Historically, falling real yields provide medium term support for Bitcoin and risk assets.
At the same time, the narrative remains conflicted. The appointment of Kevin Warsh as Federal Reserve Chair and hawkish rhetoric earlier in the month reduced expectations of near term easing. However, weakening growth data and geopolitical stress may gradually shift expectations again.
Geopolitical volatility intensified during the week, with US–Iran developments driving a sharp intraday selloff to approximately $63,000, which marked the weekly low. The subsequent recovery toward $70,000 suggests that incremental downside pressure may be moderating.
With the March FOMC meeting approaching, markets may begin to revisit monetary policy expectations. For now, fundamental and macro drivers are at the mercy of geopolitical developments, and traditional trend drivers such as inflation data, labor data, and ETF flows are secondary this week.
Market Movers and Events, Last Week
Market data and flows
Crypto market cap: $2.27T, down 1.7% week on week
Average weekly volume: $98B, up 14%
Bitcoin weekly volume: $41.1B, up 20%
Ethereum weekly volume: $20.9B, up 3%
Ethereum network fees: 0.06 Gwei
Volumes have modestly recovered, though liquidations remain contained, suggesting traders have largely adjusted positioning.
Futures and positioning
Bitcoin funding rate: -0.5%
Bitcoin open interest: $19.6B, down $1B
Ethereum funding rate: 15%
Ethereum open interest: $10.2B
Leverage has largely reset. Bitcoin funding briefly turned negative, reflecting defensive positioning and reduced long exposure. Open interest has declined materially, reducing liquidation risk.
Whale distribution remains a structural headwind. Since October 2025, approximately $30B in net outflows from large holders have been observed. Whales now account for roughly 64% of exchange deposits, reflecting continued supply overhang.
ETF flows
Bitcoin ETF flows over 7 days: +$787M
Ethereum ETF flows over 7 days: -$80M
Bitcoin ETFs recorded one of their strongest weeks of inflows since October, marking a meaningful shift after several consecutive weeks of outflows totaling $4.3B.
While some inflows may reflect funding rate arbitrage rather than outright directional conviction, the scale suggests stabilization in marginal demand.
Ethereum ETF flows remain structurally weak, with cumulative outflows since August 2025.
Stablecoins and liquidity
USDT market cap: $183.6B
USDC market cap: $75.1B, up 0.9%
Stablecoin net flows over 30 days: +$0.4B
Stablecoin minting has modestly improved. While still not signaling strong structural inflows, liquidity conditions appear to be stabilizing at the margin.
Year to date crypto liquidity remains negative at approximately -$13.6B.
Dominance
Bitcoin dominance: 58%
Ethereum dominance: 10.3%
The altcoin model remains bearish, and Bitcoin continues to attract defensive capital allocation.
Key headlines
On-chain real world assets accelerate
Coinbase, Binance, and Kraken simultaneously launched tokenized equity products, signaling that on chain real world assets are transitioning from niche to mainstream infrastructure. On chain RWA assets are up nearly 300% year over year.
Meta moves toward stablecoin integration
Meta confirmed discussions to integrate third party stablecoin payments without issuing its own token. This reinforces that stablecoins are increasingly viewed as payment infrastructure rather than speculative instruments.
Dutch government revisits unrealized crypto gains tax
The Dutch Finance Minister announced intentions to amend proposed legislation requiring taxation on unrealized digital asset gains, signaling ongoing regulatory recalibration in Europe.
Key Macro Drivers, The Week Ahead
Mar 2: ISM Manufacturing PMI (Feb) Actual: 52.4 | Consensus: 51.8 The stronger than expected print signals continued resilience in manufacturing, which may temper immediate rate cut expectations.
Mar 4: ADP Employment Change (Feb) Private payroll data will provide an early signal ahead of Friday’s official jobs report. A stronger than expected print could reinforce higher for longer rate expectations, while a weaker number would support the slowdown narrative.
Mar 6: Nonfarm Payrolls (Feb) The key macro event of the week. Labor market strength or weakness will directly influence rate expectations and Treasury yields. A downside surprise would likely reinforce falling yield dynamics and could provide tactical support to risk assets, including crypto.
Token Unlocks
Mar 1: SUI – ~$48.6M
Mar 2: ENA – ~$4.3M
Mar 5: POWER – ~$23M
Mar 6: HYPE – ~$316.6M (largest unlock of the week)
Mar 6: RED – ~$6M
Mar 7: OP – ~$2.4M
Mar 8: STABLE – ~$29.4M
HYPE represents the most material liquidity event this week.
Market Outlook
Sentiment
Bitcoin Greed and Fear Index: 15% (vs. 5% last week)
Ethereum Greed and Fear Index: 20% (vs. 7% last week)
Bitcoin
Key levels
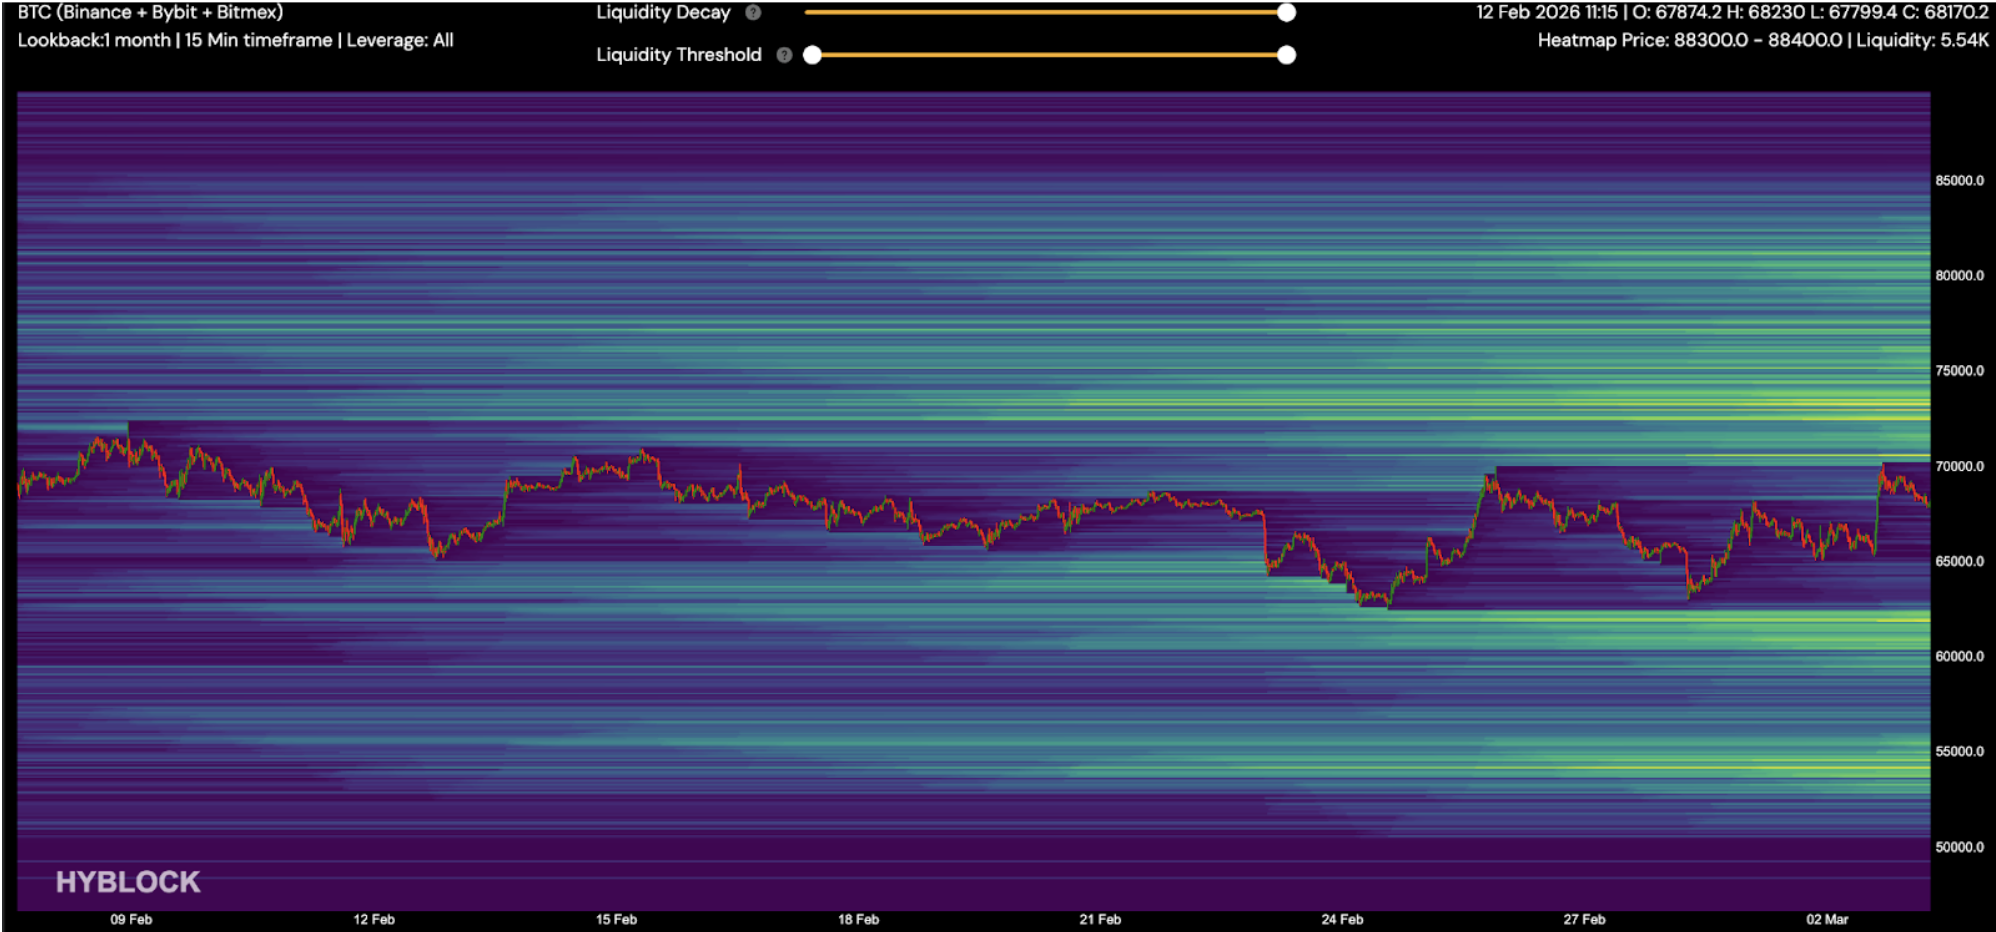
Current price: approximately $68,000
Immediate resistance: $70,000
Critical reclaim level: sustained hold above $72,500
Upside liquidity pool: $73,500
Downside liquidity pool: $62,000 and $54,000
Base case
Continued consolidation with a modest upside bias. Bitcoin likely needs to reclaim $70,000 to trigger a stronger buy signal. Without sustained inflows, rallies may remain tactical rather than structural.
Opening new short positions at current levels appears increasingly unattractive, as leverage has already reset, ETF flows are improving, and technical indicators suggest the market is oversold.
Ethereum
Ethereum remains structurally weaker than Bitcoin and continues to lack consistent institutional inflows.
Key levels
Current price: approximately $2,000
Resistance: $2,200
Upside liquidity pool: $2,150
Downside liquidity pool: $1,780 and $1,650
ETH remains reactive to Bitcoin and broader liquidity conditions.
Altcoins
The altcoin model remains bearish. Exposure should remain limited until structural flows improve.
Access Rain’s app, which is available on the Apple App Store and Google Play Store.

Copyright © 2026 Rain Trading Limited