


Weekly Crypto Outlook – February 2, 2026
Crypto markets enter February under intense liquidation pressure as Bitcoin approaches major technical support near prior cycle lows. With macro uncertainty, trade tensions, and geopolitical risks elevated, volatility remains extreme while the broader move is still framed as a liquidity grab rather than a structural bear market.


TL;DR
Crypto markets enter the first week of February with downside price action accelerating sharply, confirming that the broader corrective roadmap mapped out over recent weeks remains intact. Bitcoin briefly attempted a relief rally from the USD 86,000 zone early last week but quickly rolled over, swept the October lows, and is now trading around USD 76,800, with the next obvious technical magnet being a sweep of the April 08, 2025 low near USD 74,500.
Macro and geopolitical conditions remain unstable: the US is now effectively in a partial government shutdown, global trade and tariff tension has re-escalated (Canada, Mexico, South Korea), and conflict risk linked to the US–Iran backdrop remains elevated. In this setup, volatility should be assumed to remain extreme, and the base case remains a liquidity grab (not a full bear market), with weakness into the low-to-mid USD 70,000s followed by a strong recovery.
In This Week’s Note
Macro View
Market Movers and Events, Last Week
Key Macro Drivers, The Week Ahead
Market Outlook
Macro View
From liquidity stress to liquidation-driven volatility
Crypto markets have transitioned from a fragile corrective environment into a more aggressive liquidation regime. The relief rally attempts have failed quickly, confirming that positioning and liquidity remain the dominant forces rather than fundamentals or adoption narratives.
Macro conditions are not supportive of stable risk appetite. The US has entered what is effectively a partial government shutdown, and even if politically resolved quickly, this period tends to reduce liquidity and increase headline-driven volatility across assets.
Trade tensions have also re-emerged as a volatility catalyst. President Trump’s renewed tariff threats against key allies (Canada, Mexico, South Korea) have raised cross-asset fragility in a period where liquidity is already thin.
US–Iran risk window: Dahe-ye Fajr (Feb 01 to Feb 11)
An additional geopolitical volatility factor this week is the Dahe-ye Fajr window (Feb 01 to Feb 11) in Iran. This is the commemorative 10-day period marking the anniversary of Ayatollah Khomeini’s return to Iran and the lead-up to the 1979 revolution’s victory celebrations.
From a political standpoint, if the US wanted to apply pressure or send deterrence signals, doing so during this highly symbolic period could generate outsized internal political discomfort for Iran, raising the risk of escalation headlines and risk-off shocks. Even without action, the market must price the risk of action.
Market Movers and Events, Last Week
Market data and flows
Crypto market cap: USD 2.6T, down 10.7% week-on-week
Average weekly volume: USD 133B, higher on forced selling
Bitcoin weekly volume: USD 51.6B
Ethereum weekly volume: USD 31.7B
Ethereum network fees: ~0.15 Gwei (still relatively low activity despite volatility)
Futures and positioning
Bitcoin funding: 3.9%, while futures open interest dropped sharply by USD 3.6B to USD 24.2B
Ethereum funding: collapsed to -16.9%, while open interest declined by USD 4.5B to USD 11.7B
This is consistent with heavy long liquidation and forced deleveraging.
ETFs
Bitcoin ETF flows (7d): USD -1.5B outflows
Ethereum ETF flows (7d): USD -328M outflows
ETF selling remains a direct headwind on spot in a fragile liquidity environment.
Stablecoins
USDT market cap: USD 185.3B (down 0.86% WoW)
USDC market cap: USD 70.2B (down 3.0% WoW)
Stablecoin impulse remains negative, reinforcing that risk is being removed from the system.
Dominance
Bitcoin dominance: 59.3%
Ethereum dominance: 10.7%
Key headlines
Tether amasses US$24B gold hoard in Swiss bunker
Tether revealed it holds ~140 tonnes of physical gold (≈ US$24B), including backing reserves and its gold-backed stablecoin XAUT.
Tether launches federally regulated USAT stablecoin
Tether launched USAT via Anchorage Digital Bank, structured to operate under US regulatory frameworks.
Securitize reports 841% revenue growth ahead of listing
Tokenization firm Securitize filed toward a SPAC listing, highlighting accelerating institutional adoption of tokenized securities.
Hyperliquid: HIP-3 open interest hits record high (USD 790M)
Driven by increased commodities trading activity and the new HIP-3 framework enabling permissionless perps deployment via staking.
CLARITY Act continues to stall
Market structure regulation remains delayed in the Senate, prolonging regulatory uncertainty.
Key Macro Drivers, The Week Ahead
Thin liquidity means macro catalysts can amplify price moves.
Economic calendar
Feb 02: ISM Manufacturing PMI
Feb 02: Trump & Coinbase Crypto Bill discussion
Feb 03: Peak Q4 earnings (broad market)
Feb 04: ADP Employment Change
Feb 04: ISM Services PMI
Feb 05: MSTR earnings call
Feb 06: Average Hourly Earnings (MoM / YoY)
Feb 06: Nonfarm Payrolls
Feb 06: Michigan Consumer Sentiment Index
Crypto-specific catalysts
Feb 06: Token unlocks: HYPE (USD 309M), BERA (USD 36M)
Market Outlook
Sentiment
Bitcoin Greed & Fear Index: 14% (vs. 20% last week)
Ethereum Greed & Fear Index: 17% (vs. 25% last week)
Sentiment has collapsed to extreme fear levels, reflecting broad capitulation and very defensive positioning. Historically, such depressed readings tend to coincide with late-stage selloffs and can precede sharp tactical rebounds, though they do not on their own confirm a durable bottom.
Bitcoin
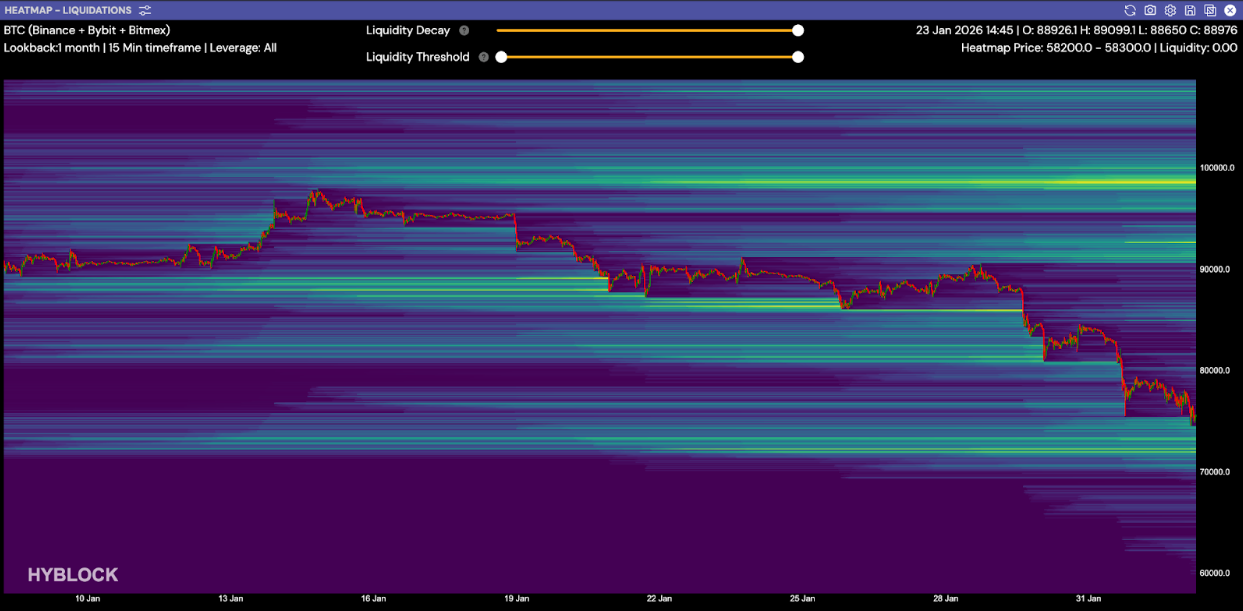
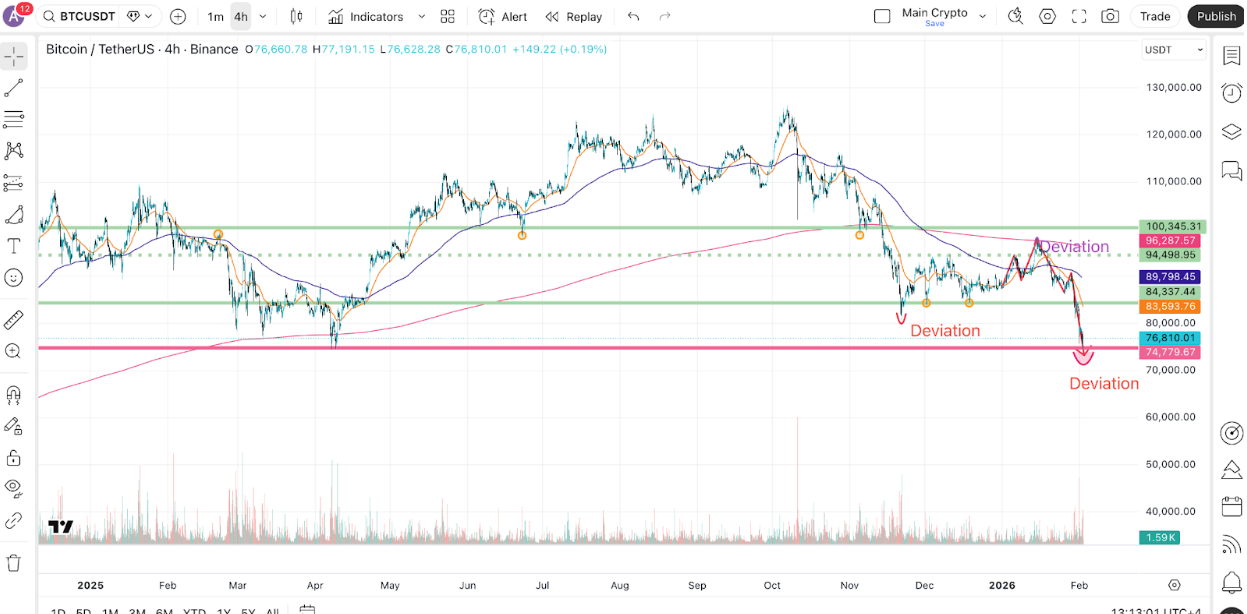
Bitcoin is now deep into the liquidation-driven leg lower, and the market is behaving exactly like a downside liquidity grab environment. After sweeping the October lows, price is trading around USD 76,500 and is approaching a major reference level at the April 08, 2025 low near USD 74,500.
Importantly, this is not being framed as a structural bear market, but as a high-efficiency liquidity trap: liquidation pressure drives price into obvious lows where forced sellers exhaust, then the market can rebound sharply.
Key levels
Current price: ~USD 76,800
Key downside magnet: USD 74,500 (Apr 08, 2025 low)
Liquidation pool expected to clear on sweep: USD 72,000–73,000
Base case
A liquidity sweep into the low-to-mid USD 70,000s, likely involving a clean sweep of USD 74,500, clearing liquidation below in USD 72,000–73,000, followed by a strong recovery as forced selling exhausts.
Bearish scenario trigger
Finding acceptance below USD 73,000 would bring the bearish continuation scenario into play.
Ethereum
Ethereum remains structurally weaker than Bitcoin and remains vulnerable in any continuation leg lower. Unlike BTC, ETH tends to overshoot on liquidation moves due to thinner structural support and higher reflexivity in derivatives.
The April 08, 2025 low is around USD 2,100, which makes a downside sweep into the USD 2,000 zone the clean “liquidity magnet” equivalent of BTC’s USD 74,500 level.
Key levels
Upside liquidity: USD 2,400 and USD 2,500
Key downside reference: USD 2,100 (Apr 08, 2025 low)
Sweep zone / liquidation risk: USD 2,000 area
ETH remains fragile unless it can reclaim and hold higher, and will likely remain reactive to BTC path and macro headlines.
Altcoins
Altcoin performance remains unstable and reactive. In liquidation-driven markets, altcoins tend to underperform structurally due to thinner liquidity and reflexive de-risking.
One exception to monitor closely is HYPE (Hyperliquid), which continues to show unusually strong engagement driven by the surge in commodity perpetuals activity and record open interest under HIP-3. That said, with a major unlock this week, volatility risk remains high even for relative strength leaders.
Exposure should remain tactical and focused only on deep liquidity names.
Disclaimer: This content presents objective market data and does not constitute investment advice.

Copyright © 2026 Rain Trading Limited