


Weekly Crypto Outlook – March 23, 2026
Crypto markets enter the week with a more fragile tone as macro and geopolitical risks take center stage. While Bitcoin shows relative resilience, weakening sentiment and liquidity conditions point to a cautious outlook. Key support levels for BTC and ETH will be critical in determining the next move.


TL;DR
Crypto markets enter the week on a more fragile footing, with macro and geopolitical risks now clearly outweighing the more constructive positioning signals seen earlier in March.
Bitcoin has held up better than most major asset classes despite the recent drawdown. Since the start of the latest Iran-related stress period, Bitcoin remains up 10.7%, while the Stoxx 600 is down 7.7% and gold is down 9.8%. That relative resilience matters. However, underneath the surface, the tone has weakened materially. The recent rebound has faded, funding remains deeply negative, whale distribution is still significant, and market conviction has softened following the hawkish interpretation of the latest FOMC meeting.
Flows remain a partial offset. ETF inflows have improved from the November to February weakness, and both BTC and ETH products continue to attract capital. But stablecoin expansion has stalled again, volumes remain mixed, and the market is no longer being supported by broad-based liquidity improvement.
Our stance for the week shifts to neutral with a bearish bias. Bitcoin and Ethereum are both approaching key support levels that must hold to preserve the broader bullish structure. For Bitcoin, the critical zone sits at $65,600, with a break below materially increasing the risk of a move toward $60,000. For Ethereum, the equivalent line in the sand remains $2,025. Until those levels are clearly defended, rallies are likely to be sold rather than chased.
In This Week’s Note
Macro View
Market Movers and Events, Last Week
Key Macro Drivers, The Week Ahead
Market Outlook
Macro View
Macro has reasserted itself, and the market is reacting accordingly.
This week marked a clear change in tone. The market was forced to confront a more hostile macro backdrop just as geopolitical uncertainty remains elevated.
The latest FOMC meeting was interpreted as a hawkish pause. While the Fed did not tighten policy further, the signal to markets was that policymakers remain reluctant to ease in the face of energy-related inflation risks. That shift has pushed rate cut expectations materially lower, with the probability of a June cut falling to just 1.9%.
At the same time, geopolitical tensions remain unresolved. The risk is no longer episodic volatility but a more persistent drag on global risk appetite. Oil-linked inflation risks, tighter financial conditions, and a broader risk-off tone are combining to keep traders cautious.
Bitcoin has still outperformed many traditional assets during this stress period. Even after the recent decline, Bitcoin has held up materially better than European equities and gold. This reinforces the idea that Bitcoin is increasingly behaving as a more resilient macro asset when confidence in traditional markets weakens.
However, short liquidations have largely run their course, roughly $500M of short exposure has been flushed, while whale distribution since October 2025 has exceeded $37.5B.
Taken together, the macro backdrop argues for caution.
Market Movers and Events, Last Week
Market data and flows
Crypto market cap: $2.34T, down 4.5% week on week
Average weekly volume: $97B, broadly stable
Bitcoin weekly volume: $40.2B, lower than usual
Ethereum weekly volume: $22.4B, slightly stronger
Ethereum network fees: 0.07 Gwei, indicating weak network usage
The overall picture is one of weakening participation rather than panic.
Futures and positioning
Bitcoin funding rate: -2.5%, significantly negative
Bitcoin open interest: $21.4B, down $300M
Ethereum funding rate: -0.9%, also negative
Ethereum open interest: $11.7B, down $200M
Positioning has deteriorated, with traders closing long exposure and maintaining defensive hedges.
ETF flows
Bitcoin ETF inflows (7 days): $92M
Bitcoin ETF inflows (30 days): $2.1B
Ethereum ETF inflows (7 days): $212M
Ethereum ETF inflows (30 days): $347M
Flows remain constructive but unstable and highly sensitive to macro developments.
Stablecoins and liquidity
USDT market cap: $184.1B, up 0.05% week on week
USDC market cap: $78.9B, down 0.3% week on week
Weekly net stablecoin change: -$0.1B
Total minted over last 30 days: $4.3B
Liquidity expansion is not yet strong enough to support sustained upside.
Dominance
Bitcoin dominance: 58.1%
Ethereum dominance: 10.6%
Leadership remains defensive, favoring Bitcoin over broad altcoin exposure.
Key headlines
SEC publishes first crypto asset taxonomy
The SEC, alongside the CFTC, released guidance defining formal categories for digital assets under US securities law. The move represents a meaningful step toward clearer market structure.
Nasdaq approved to launch tokenised securities pilot
Nasdaq received approval to trade tokenised versions of selected equities and ETFs, highlighting growing institutional acceptance of tokenisation.
S&P 500 perpetual futures go live on Hyperliquid
USDC-settled perpetual futures tracking the S&P 500 launched on Hyperliquid, reflecting continued expansion of on-chain derivatives markets.
Key Macro Drivers, The Week Ahead
Mar 24: S&P Global Manufacturing PMI (Preliminary) - One of the first indicators capturing economic activity following the recent geopolitical escalation. A weaker reading could signal early signs that higher energy costs and uncertainty are weighing on industrial activity.
Mar 24: S&P Global Services PMI (Preliminary) - A key gauge of overall US economic momentum given the dominant share of services in GDP. A reading above 50 would indicate continued expansion and could reinforce higher-for-longer rate expectations. A reading below 50 may intensify growth concerns and challenge the recent hawkish repricing of the Fed path.
Ongoing US - Iran tensions: Geopolitical developments remain the dominant market driver, with escalation risks likely to continue influencing risk sentiment and volatility across asset classes.
Token Unlocks
Mar 23: River (RIVER) – ~1% of supply (~$18.42M)
Mar 23: SOON (SOON) – ~5.06% of circulating supply (~$2.8M)
Mar 24: Toncoin (TON) – ~0.72% of circulating supply (~$46.1M)
Mar 25: Plasma (XPL) – ~3.98% of circulating supply (~$8.4M)
Mar 28: Jupiter (JUP) – ~1.55% of circulating supply (~$8.3M)
Market Outlook
Sentiment
Bitcoin Greed and Fear Index: 26%, down from 65% last week
Ethereum Greed and Fear Index: 44%, down from 70% last week
Sentiment has weakened sharply week on week.
Bitcoin
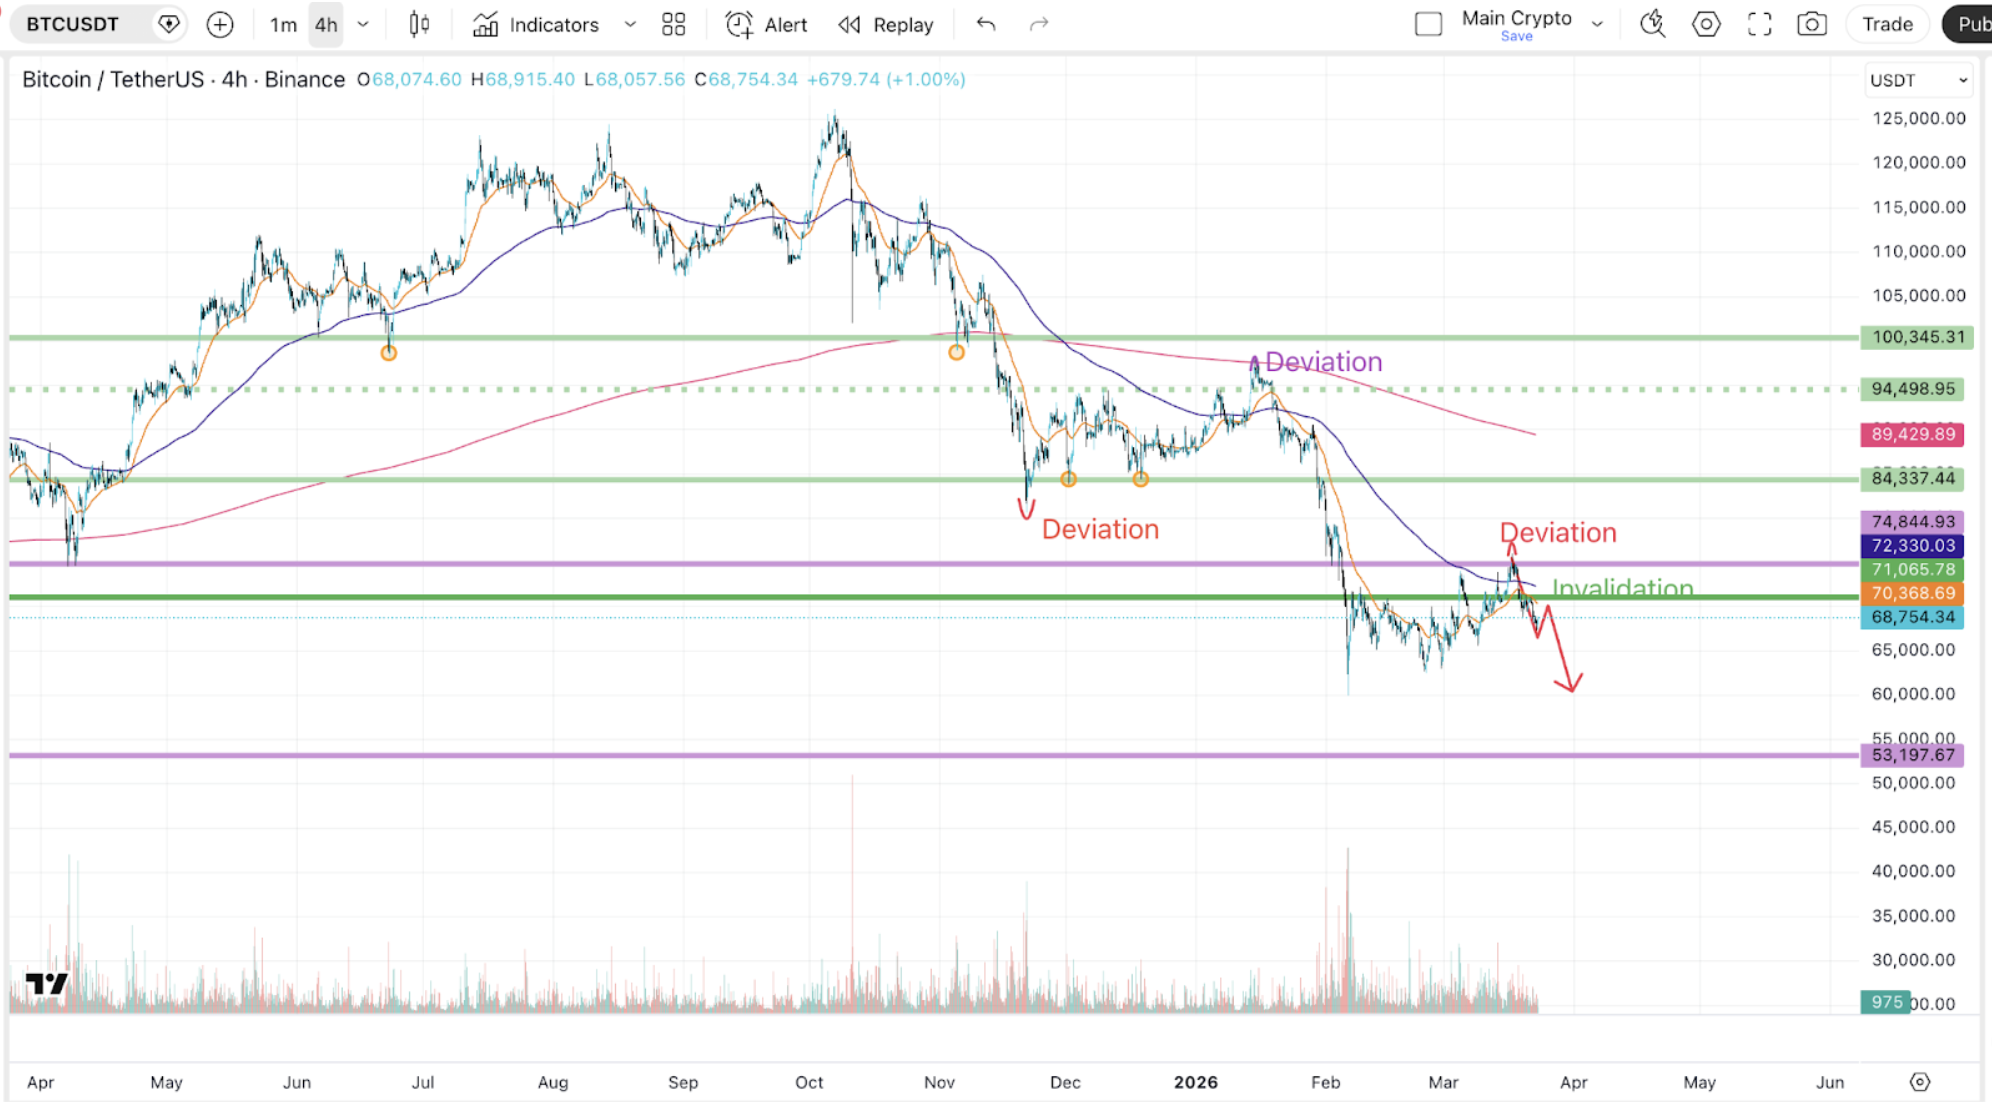
The market attempted to break above $75,000 last week but failed to hold the move, with downside accelerating after the FOMC meeting.
For this week, an early push toward the CME gap at $70.1K is possible.
However, further weakness is the preferred scenario, with downside liquidity clusters near $66,500 and $64,500. A break below $65,600 increases probability of $60,000. Invalidation above $71K opens path toward $76,600 and potentially $79K.
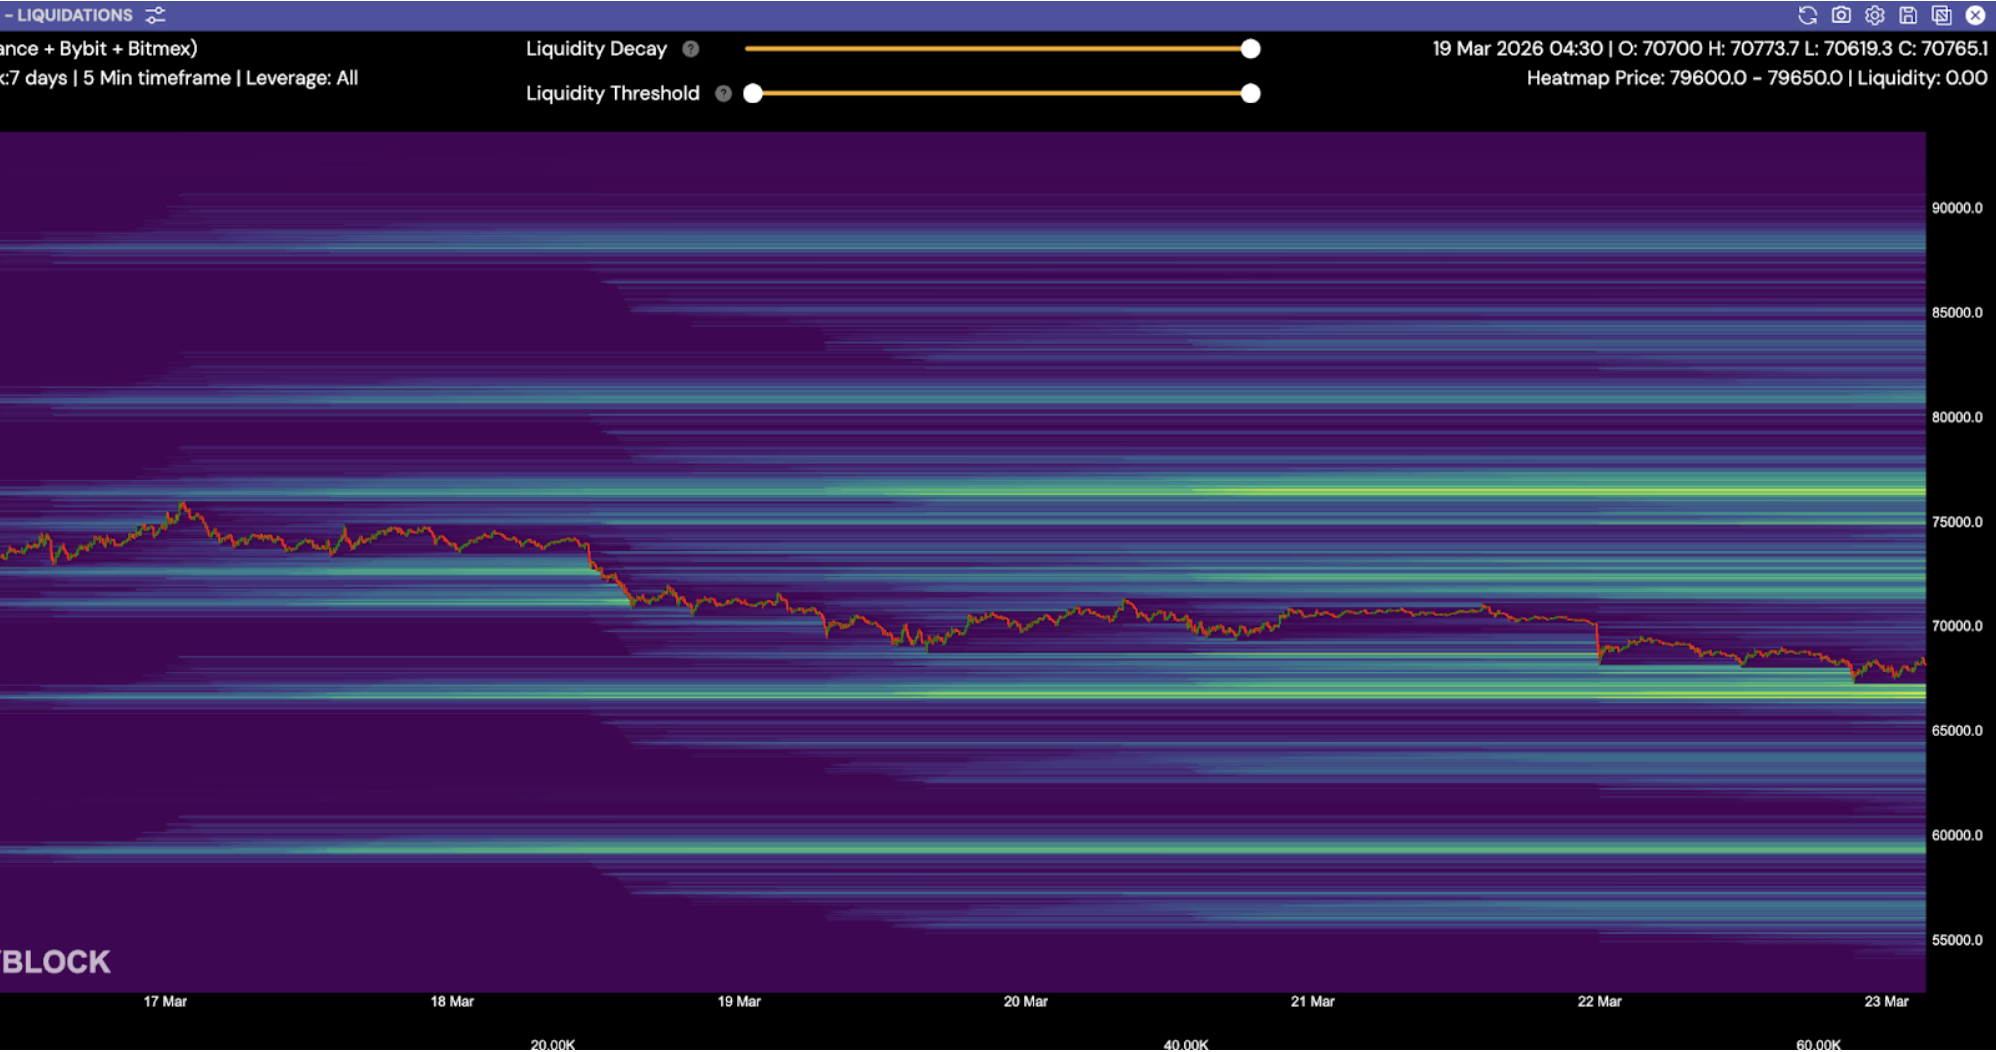
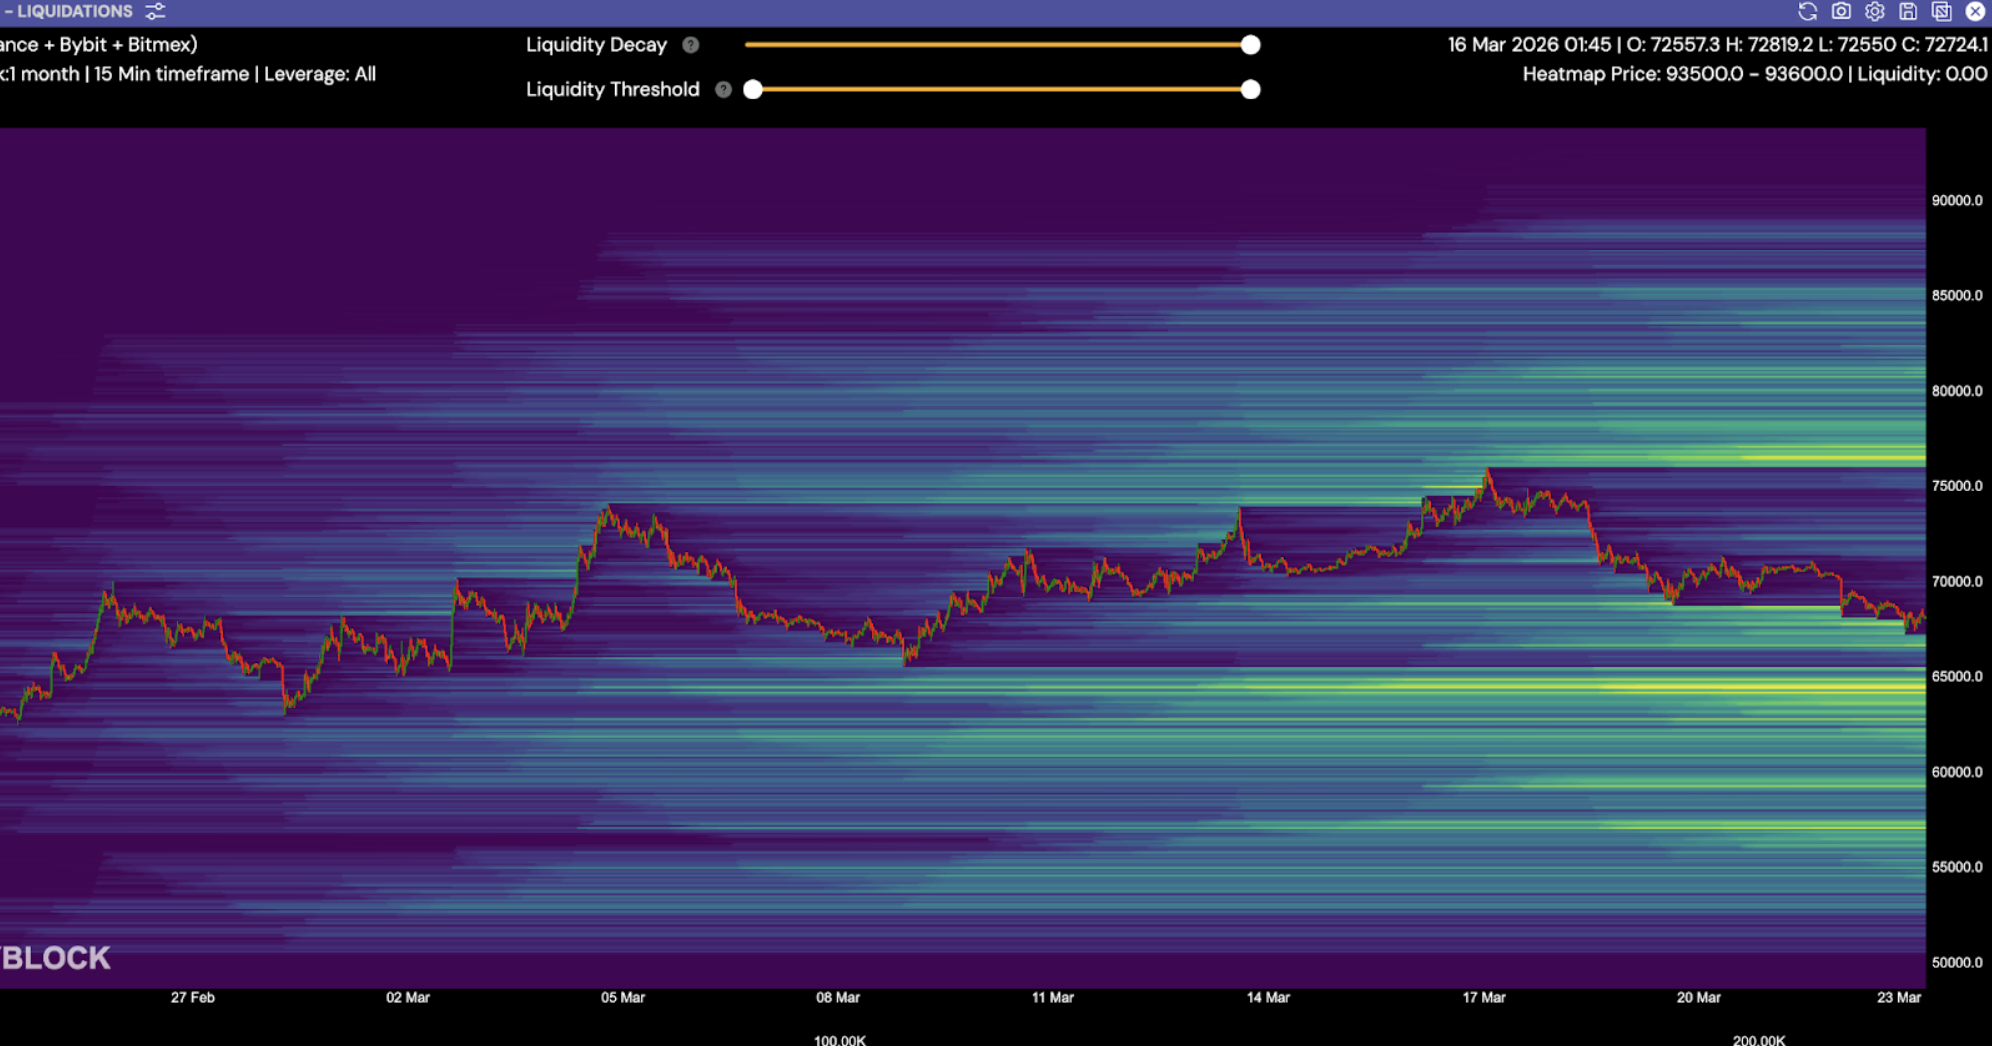
Line in the sand: $65,600
Downside risk on break: $60,000
Resistance: CME gap near $70.1K
Acceptance above $71K opens move toward $79K
Upside liquidity pool: $76,600
Downside liquidity pools: $66,500 and $64,500
Ethereum
Line in the sand: $2,025
Upside liquidity pool: $2,400
Downside liquidity pools: $1,860
ETH continues to lag BTC.
Altcoins
Model favors Bitcoin. Selectivity remains key.
Disclaimer: This content presents objective market data and does not constitute investment advice.

Copyright © 2026 Rain Management W.L.L.