


Weekly Crypto Outlook – January 05, 2026
Crypto markets enter 2026 with stronger price action, rising leverage, and improving sentiment, while liquidity creation remains weak. ETF inflows have turned positive, but stablecoin contraction signals recycled liquidity rather than expansion. The near-term outlook favors a tactical move toward key liquidity zones, followed by corrective risk.


TL;DR
Crypto markets are starting 2026 with improving price action, rising leverage, and early signs of renewed risk appetite, but participation remains selective. Volumes have recovered toward normal levels, futures open interest is increasing again, and ETF flows have turned positive at the start of the year, while stablecoin inflows remain absent, signaling recycled rather than expanding liquidity. A rapid de-escalation of geopolitical risk following a contained US military operation in Venezuela helped stabilize broader risk sentiment late last week, supporting the rebound at a time when positioning was already fragile. The base case favors a liquidity-driven move toward the USD 95,000 to USD 96,000 zone, followed by a corrective reversal rather than sustained continuation toward USD 100,000, reflecting leverage rebuilding faster than liquidity. Near term, US data may trigger short-term volatility, but positioning, ETF flows, and derivatives dynamics remain the primary drivers of direction, reinforcing the need for tactical execution and disciplined profit-taking.
In This Week’s Note
Macro View
Market Movers and Events, Last Week
Key Macro Drivers, The Week Ahead
Market Outlook
Macro View
From macro dominance to positioning dominance
Macro drivers remain largely absent in the near term. With no immediate monetary or geopolitical catalysts, crypto markets are increasingly governed by flows, derivatives positioning, volatility regimes, and internal structure rather than macro repricing.
Geopolitical risk briefly eased over the weekend, contributing to improved global risk sentiment. Reports of a swift and contained US military operation in Venezuela reduced near-term uncertainty around energy supply and regional instability. While not a structural driver for digital assets, the rapid de-escalation helped remove a tail-risk overhang at a time when positioning was already fragile, likely supporting the late-week rebound.
What makes the current environment unusual is the divergence between improving technical and positioning signals and still-weak liquidity creation. Futures leverage is rebuilding, sentiment has improved sharply, and trend indicators have turned constructive, yet stablecoin supply continues to contract. This combination suggests that risk is re-entering the system faster than liquidity, creating conditions for price movement without strong durability.
This phase often feels comfortable on the surface, while underlying fragility quietly increases.
Market Movers and Events, Last Week
Market data and flows
Crypto market capitalization increased to approximately USD 3.08 trillion, up 4.1% week on week.
Average weekly trading volume rose to USD 82 billion, broadly in line with longer-term averages.
Bitcoin weekly volume reached USD 30.2 billion, slightly above average.
Ethereum weekly volume increased to USD 16.2 billion, around 9% above average.
Ethereum network fees remain near 0.04 Gwei, indicating persistently low on-chain activity.
Futures and positioning
Bitcoin futures positioning turned more constructive. Funding increased to 9.3%, while futures open interest rose by approximately USD 1.2 billion to USD 29.0 billion. This points to new long positioning rather than short covering, even as participation remains selective.
Ethereum positioning also expanded, with futures open interest increasing by approximately USD 1.8 billion to USD 19.6 billion. ETH funding eased to 4.6%, suggesting position building without aggressive leverage, more consistent with spot-driven accumulation.
ETFs
ETF flows improved meaningfully at the start of the year.
Bitcoin ETFs recorded approximately USD 471 million in inflows on the first trading day of 2026 and USD 183 million over the past 7 days.
Ethereum ETFs recorded USD 175 million in inflows on the first trading day of 2026, though the past week remains net negative.
While early, this marks a clear shift from the persistent outflows seen into year end.
Stablecoins
Stablecoin activity remains a constraint on durability.
USDT market capitalization stands at USD 187.1 billion, up 0.16% week on week.
USDC market capitalization declined to USD 75.3 billion, down 1.4% week on week.
Overall stablecoin supply contracted by approximately USD 0.8 billion last week, with net issuance still negative over the past 30 days.
This confirms that the current move is being funded primarily through leverage and position rotation rather than fresh liquidity creation.
Dominance
Bitcoin dominance declined to 58.6%.
Ethereum dominance declined to 12.2%.
Relative performance is beginning to tilt toward higher-beta assets, though leadership remains narrow.
Key Macro Drivers, The Week Ahead
While macro remains secondary to flows and positioning, several US data releases could act as short-term volatility catalysts in thin liquidity conditions.
US economic data
January 07: ISM Services PMI
Consensus: 52.0 to 53.0
Prior: 52.7
Market sensitivity:
A stronger-than-expected print would reinforce the soft-landing narrative and could pressure risk assets via higher rate expectations. A weaker print would support easing expectations and may provide short-term tailwinds to crypto if ETF flows remain supportive. Any reaction is likely to be tactical.
January 09: US Non-Farm Payrolls and Unemployment Rate
Payrolls consensus: +160,000 to +180,000
Unemployment rate consensus: 3.9%
Average hourly earnings consensus: +0.3% m/m
Market sensitivity:
A strong payrolls and wage print would likely support USD strength and weigh on risk assets temporarily. A weaker outcome, particularly with softer wage growth, would reinforce expectations for easier financial conditions in 2026 and could accelerate upside if positioning remains constructive. Given current structure, NFP is more likely to amplify existing trends than reverse them.
Market Outlook
Sentiment
Bitcoin Greed and Fear Index stands at 69%.
Ethereum Greed and Fear Index stands at 76%.
Sentiment has improved materially and is no longer washed out, increasing the importance of tactical discipline.
Bitcoin
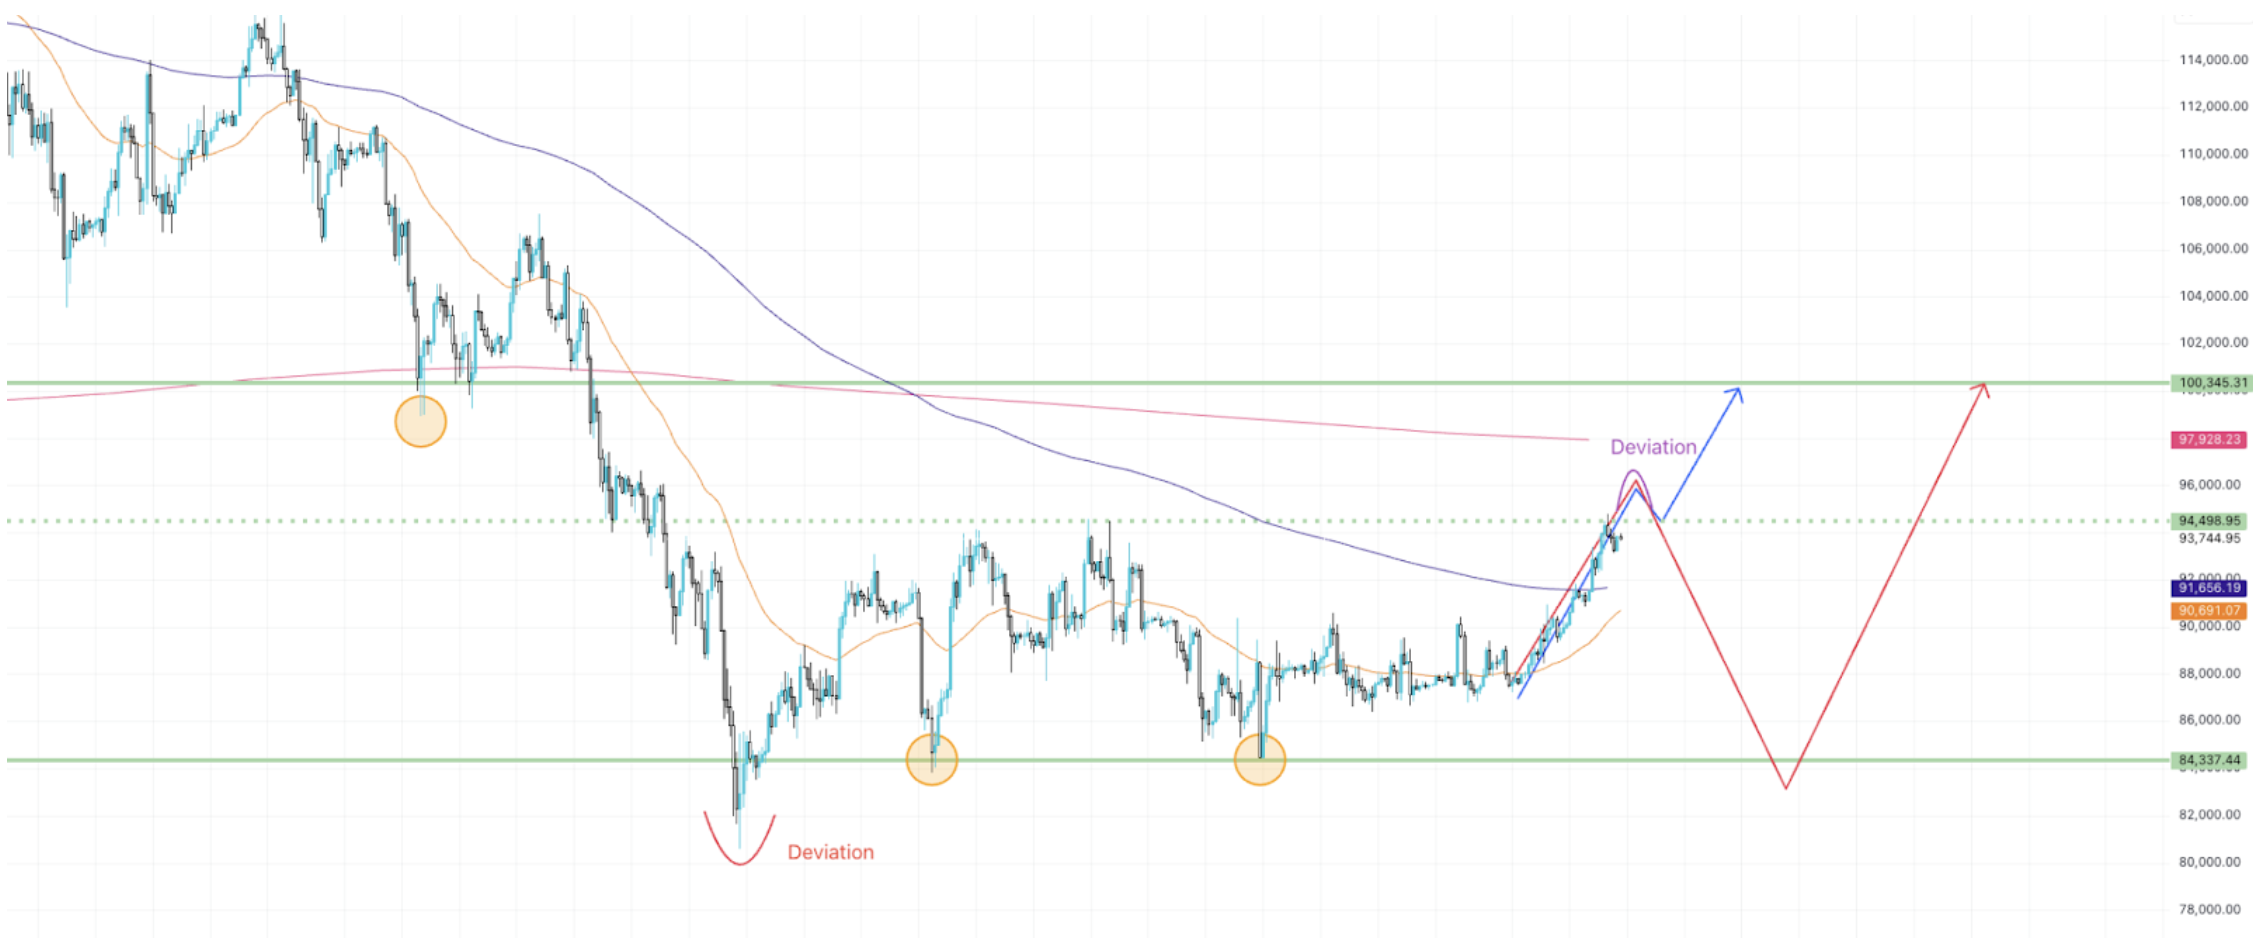
Bitcoin has entered a bullish short-term trend, supported by improving momentum indicators and rising futures positioning. Price is holding above the key short-term pivot at USD 88,636.
Liquidity remains asymmetric. Higher-timeframe liquidity is concentrated above price near USD 95,800 and USD 96,600, with the weekly 50 EMA near USD 97,900. On the downside, large liquidation zones remain near USD 86,400 and USD 84,700.
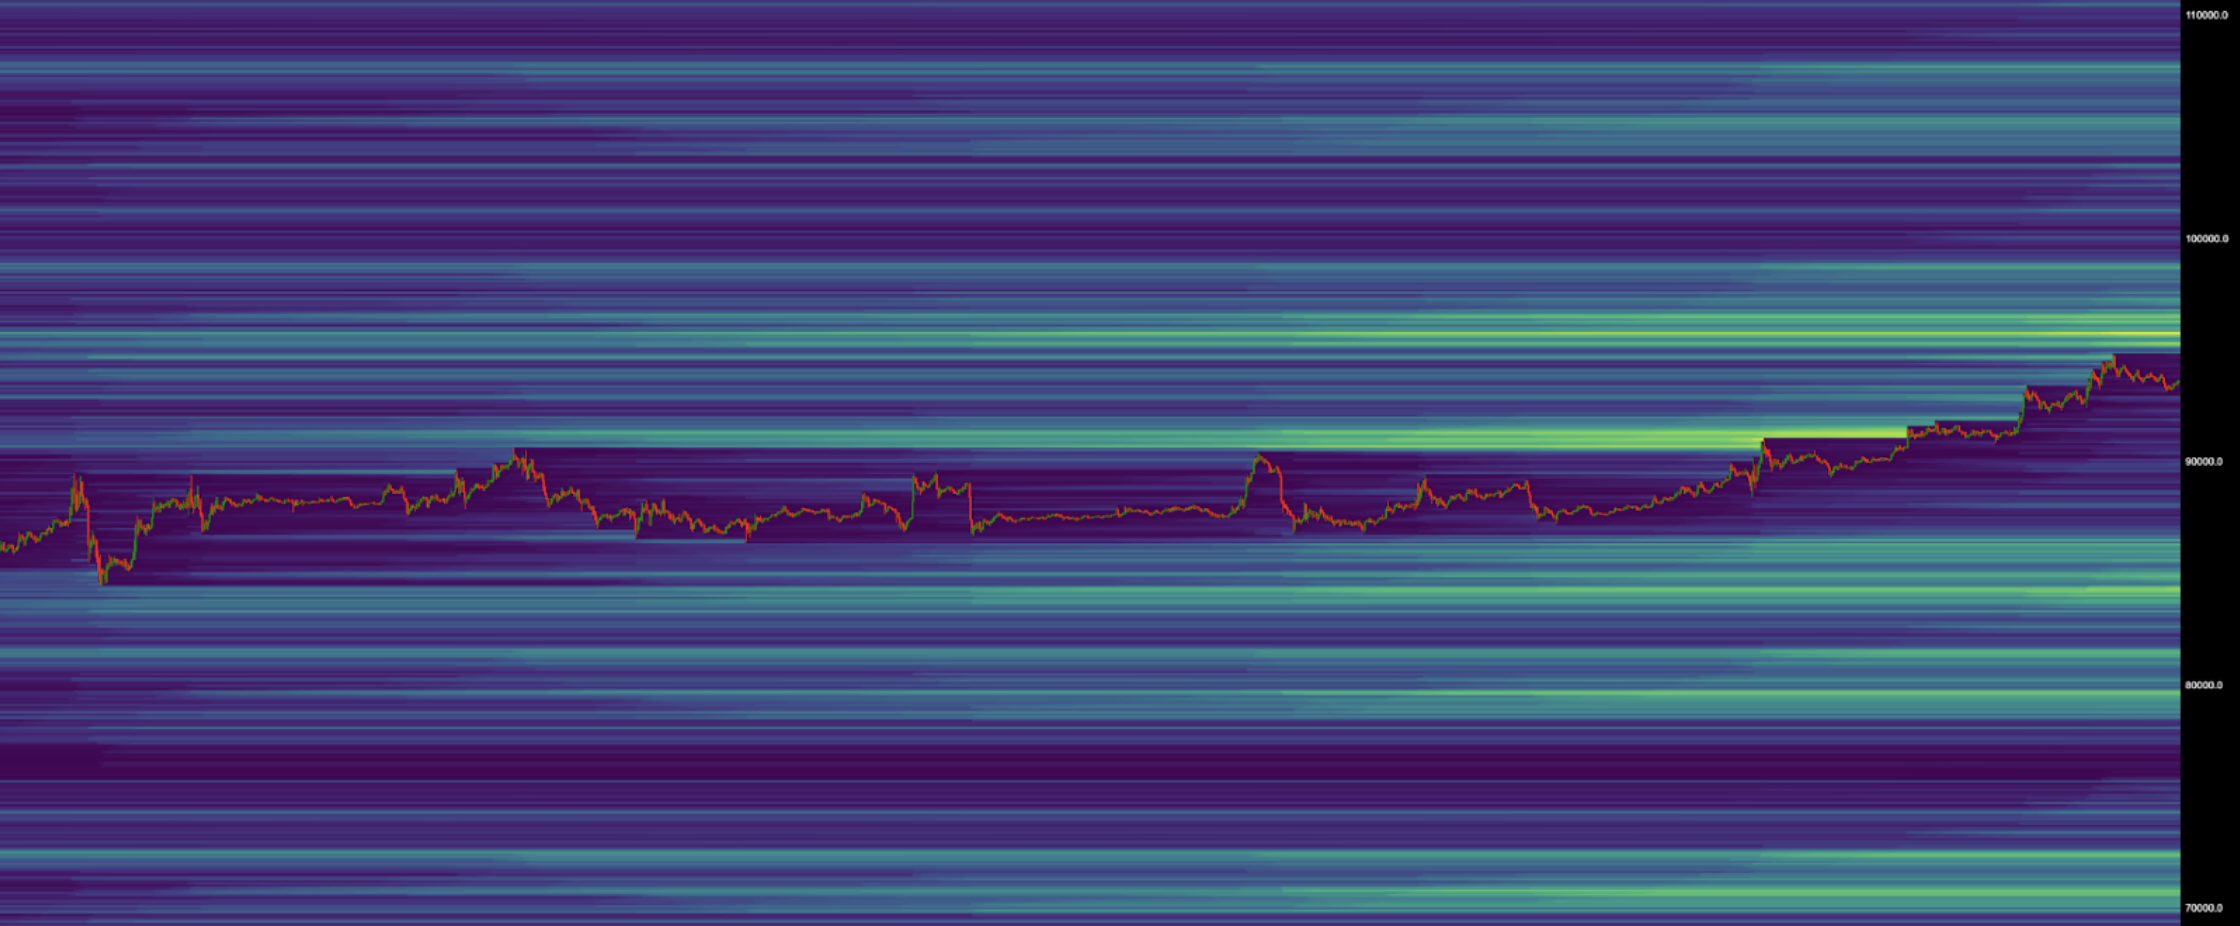
The primary scenario is continuation toward the USD 95,000 to USD 96,000 liquidity zone, with acceptance above USD 94,500 likely triggering a move to clear overhead liquidity. The more probable outcome (Red path)from that area is a reversal back toward the mid USD 80,000s to clear remaining downside liquidity, reflecting stretched positioning and still-weak liquidity conditions. Continuation toward the top of the broader range near USD 100,000 remains a secondary scenario (Blue path), contingent on a material improvement in flows and a controlled pace of leverage expansion.
Ethereum
Ethereum has also entered a bullish short-term trend but continues to lag Bitcoin structurally. Momentum has improved, but leverage remains elevated relative to participation and ETF flows have been slower to stabilize.
Downside liquidity remains concentrated near USD 2,700, while upside liquidity is clustered around USD 3,100 and USD 3,250. A sustained acceptance above USD 3,200 is required to confirm a more durable reversal. Until then, ETH strength should be treated as constructive but vulnerable to broader market pullbacks.
Altcoins
Altcoins are beginning to attract attention as Bitcoin dominance softens, but leadership remains narrow. Any rotation is likely to be selective rather than broad, favoring assets with clear economic purpose, liquidity, and structural support rather than pure beta exposure.
Disclaimer: This content presents objective market data and does not constitute investment advice.

Copyright © 2026 Rain Management W.L.L.